Visualization
This page contains information about different types of information visualization that is integrated or can be used with gem5.
O3 Pipeline Viewer
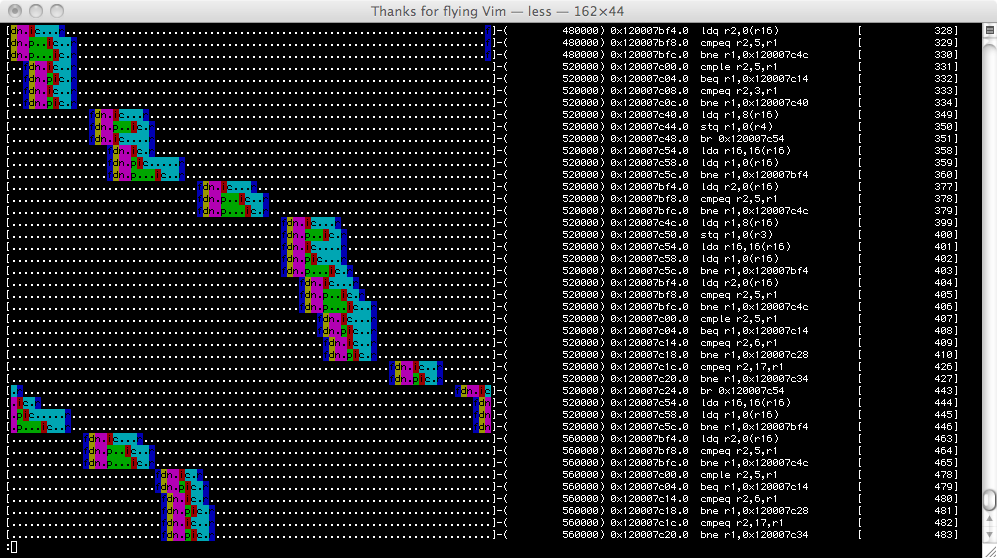
The o3 pipeline viewer is a text based viewer of the out-of-order CPU pipeline. It shows when instructions are fetched (f), decoded (d), renamed (n), dispatched (p), issued (i), completed (c), and retired (r). It is very useful for understanding where the pipeline is stalling or squashing in a reasonable small sequence of code. Next to the colorized viewer that wraps around is the tick the current instruction retired, the pc of that instruction, it’s disassembly, and the o3 sequence number for that instruction.

To generate output line you see above you first need to run an experiment with the o3 cpu:
./build/ARM/gem5.opt --debug-flags=O3PipeView --debug-start=<first tick of interest> --debug-file=trace.out configs/example/se.py --cpu-type=detailed --caches -c <path to binary> -m <last cycle of interest>
Then you can run the script to generate a trace similar to the above (500 is the number of ticks per clock (2GHz) in this case):
./util/o3-pipeview.py -c 500 -o pipeview.out --color m5out/trace.out
You can view the output in color by piping the file through less:
less -r pipeview.out
When CYCLE_TIME (-c) is wrong, Right square brackets in output may not aligned to the same column. Default value of CYCLE_TIME is 1000. Be careful.
The script has some additional integrated help: (type ‘./util/o3-pipeview.py –help’ for help).
Minor Viewer
The new page on minor viewer is yet to be made, refer to old page for documentation.
