
TraceCPU
Table of Contents
Overview
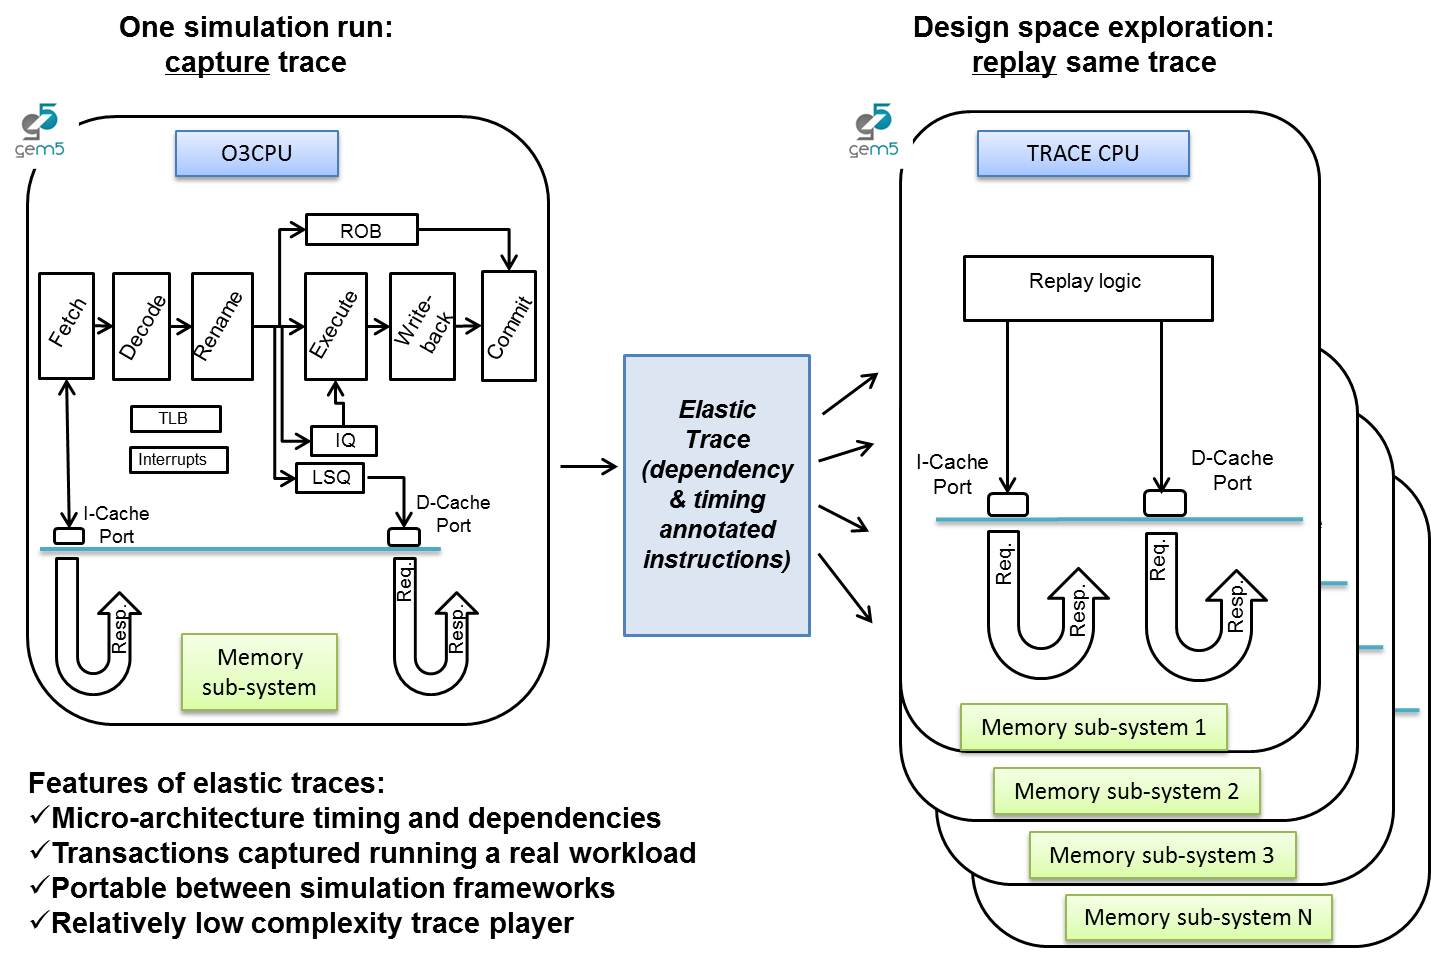
The Trace CPU model plays back elastic traces, which are dependency and timing annotated traces generated by the Elastic Trace Probe attached to the O3 CPU model. The focus of the Trace CPU model is to achieve memory-system (cache-hierarchy, interconnects and main memory) performance exploration in a fast and reasonably accurate way instead of using the detailed but slow O3 CPU model. The traces have been developed for single-threaded benchmarks simulating in both SE and FS mode. They have been correlated for 15 memory-sensitive SPEC 2006 benchmarks and a handful of HPC proxy apps by interfacing the Trace CPU with classic memory system and varying cache design parameters and DRAM memory type. In general, elastic traces can be ported to other simulation environments.
Publication:
Exploring System Performance using Elastic Traces: Fast, Accurate and Portable” Radhika Jagtap, Stephan Diestelhorst, Andreas Hansson, Matthias Jung and Norbert Wehn SAMOS 2016
Trace generation and replay methodology
Elastic Trace Generation
The Elastic Trace Probe Listener listens to Probe Points inserted in O3 CPU pipeline stages. It monitors each instruction and creates a dependency graph by recording data Read-After-Write dependencies and order dependencies between loads and stores. It writes the instruction fetch request trace and the elastic data memory request trace as two separate files as shown below.
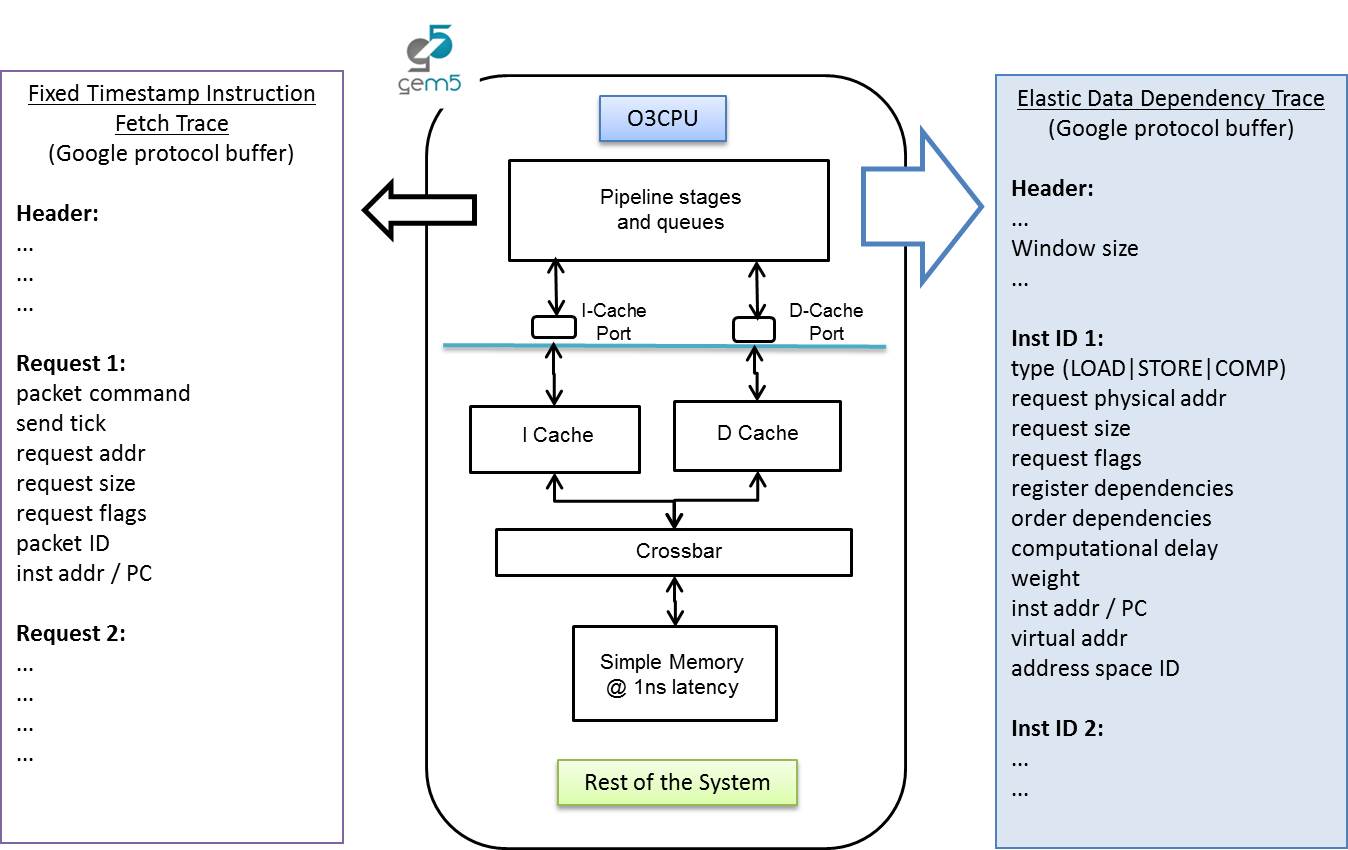
Trace file formats
The elastic data memory trace and fetch request trace are both encoded using google protobuf.
Elastic Trace fields in protobuf format
| Fields | Discritption |
|---|---|
| required uint64 seq_num | Instruction number used as an id for tracking dependencies |
| required RecordType type | RecordType enum has values: INVALID, LOAD, STORE, COMP |
| optional uint64 p_addr | Physical memory address if instruction is a load/store |
| optional uint32 size | Size in bytes of data if instruction is a load/store |
| optional uint32 flags | Flags or attributes of the access, ex. Uncacheable |
| required uint64 rob_dep | Past instruction number on which there is order (ROB) dependency |
| required uint64 comp_delay | Execution delay between the completion of the last dependency and the execution of the instruction |
| repeated uint64 reg_dep | Past instruction number on which there is RAW data dependency |
| optional uint32 weight | To account for committed instructions that were filtered out |
| optional uint64 pc | Instruction address, i.e. the program counter |
| optional uint64 v_addr | Virtual memory address if instruction is a load/store |
| optional uint32 asid | Address Space ID |
A decode script in Python is available at util/decode_inst_dep_trace.py that outputs the trace in ASCII format.
Example of a trace in ASCII
1,356521,COMP,8500::

2,35656,1,COMP,0:,1:

3,35660,1,LOAD,1748752,4,74,500:,2:

4,35660,1,COMP,0:,3:

5,35664,1,COMP,3000::,4

6,35666,1,STORE,1748752,4,74,1000:,3:,4,5

7,35666,1,COMP,3000::,4

8,35670,1,STORE,1748748,4,74,0:,6,3:,7

9,35670,1,COMP,500::,7
Each record in the instruction fetch trace has the following fields.
| Fields | Discritption |
|---|---|
| required uint64 tick | Timestamp of the access |
| required uint32 cmd | Read or Write (in this case always Read) |
| required uint64 addr | Physical memory address |
| required uint32 size | Size in bytes of data |
| optional uint32 flags | Flags or attributes of the access |
| optional uint64 pkt_id | Id of the access |
| optional uint64 pc | Instruction address, i.e. the program counter |
The decode script in Python at util/decode_packet_trace.py can be used to output the trace in ASCII format.
Compile dependencies:
You need to install google protocol buffer as the traces are recorded using this.
sudo apt-get install protobuf-compiler
sudo apt-get install libprotobuf-dev
Scripts and options
SE mode
build/ARM/gem5.opt configs/example/arm/etrace_se.py \
    --inst-trace-file fetchtrace.proto.gz \
    --data-trace-file deptrace.proto.gz \
    [WORKLOAD]
FS mode
Create a checkpoint for your region of interest and resume from the checkpoint but with O3 CPU model and tracing enabled.
# Checkpoint generation
# NOTE: fs.py is deprecated and will be removed. Do not rely too much on it
build/ARM/gem5.opt --outdir=m5out/bbench \
    ./configs/deprecated/example/fs.py [fs.py options] \
    --benchmark bbench-ics
# Checkpoint restore
# NOTE: fs.py is deprecated and will be removed. Do not rely too much on it
build/ARM/gem5.opt --outdir=m5out/bbench/capture_10M \
    ./configs/deprecated/example/fs.py [fs.py options] \
    --cpu-type=arm_detailed --caches \
    --elastic-trace-en --data-trace-file=deptrace.proto.gz --inst-trace-file=fetchtrace.proto.gz \
    --mem-type=SimpleMemory \
    --checkpoint-dir=m5out/bbench -r 0 --benchmark bbench-ics -I 10000000
Replay with Trace CPU
The execution trace generated above is then consumed by the Trace CPU as illustrated below.
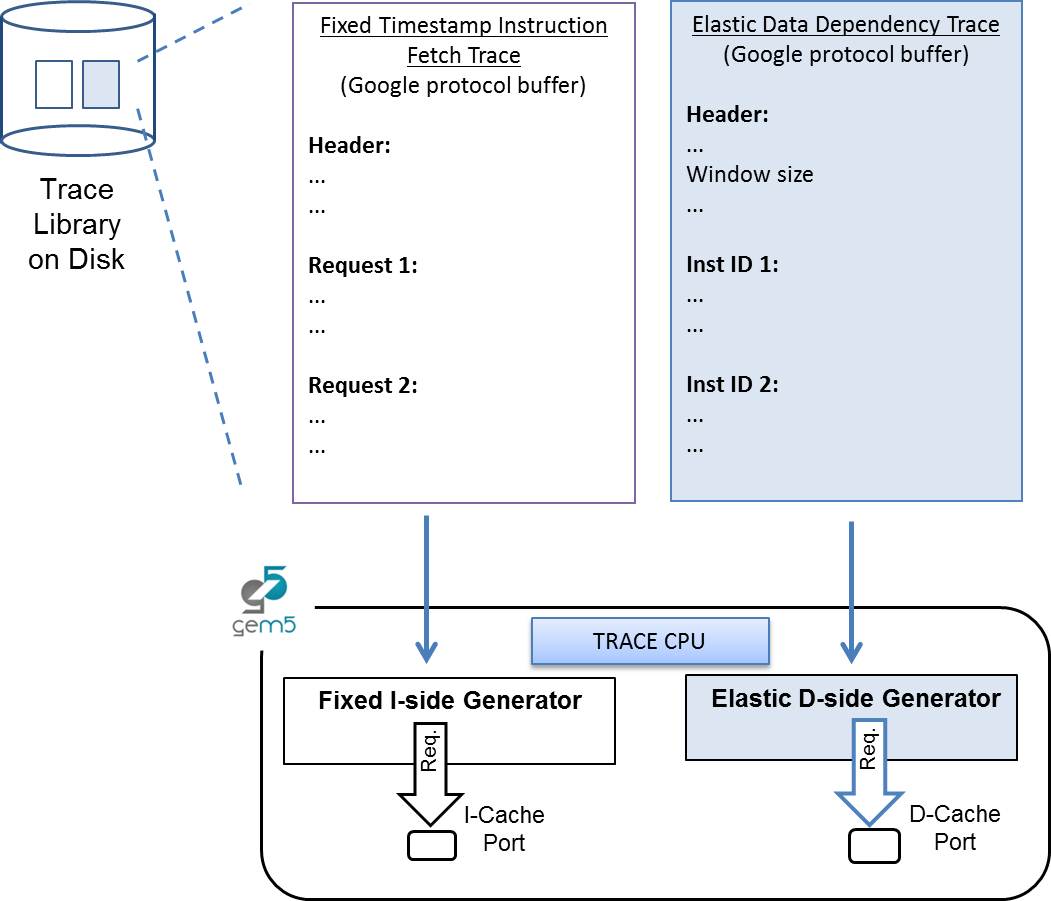
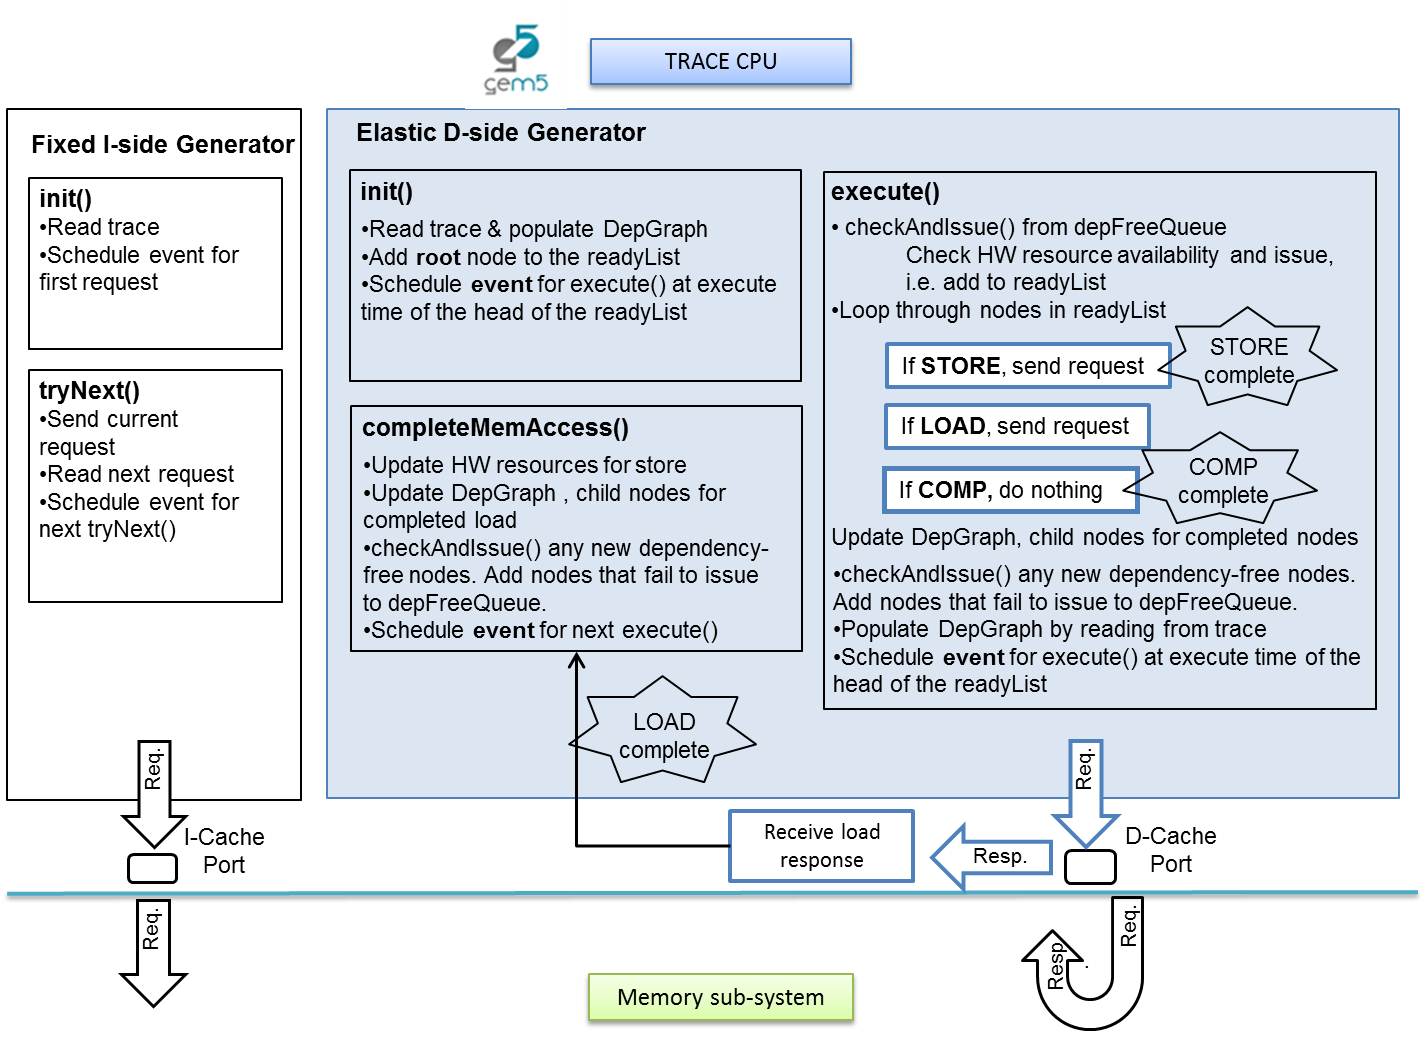
The Trace CPU model inherits from the Base CPU and interfaces with data and instruction L1 caches. A diagram of the Trace CPU explaining the major logic and control blocks is shown below.
Scripts and options
- A trace replay script in the examples folder can be used to play back SE and FS generated traces
build/ARM/gem5.opt [gem5.opt options] -d bzip_10Minsts_replay configs/example/etrace_replay.py [options] --caches --data-trace-file=bzip_10Minsts/deptrace.proto.gz --inst-trace-file=bzip_10Minsts/fetchtrace.proto.gz --mem-size=4GB
| Fields | Discritption |
|---|---|
| required uint64 seq_num | Timestamp of the access |
| required RecordType type | Read or Write (in this case always Read) |
| optional uint64 p_addr | Physical memory address if instruction is a load/store |
| optional uint32 size | Size in bytes of data if instruction is a load/store |
| optional uint32 flags | Flags or attributes of the access, ex. Uncacheable |
| required uint64 rob_dep | Past instruction number on which there is order (ROB) dependency |
| required uint64 comp_delay | Execution delay between the completion of the last dependency and the execution of the instruction |
| repeated uint64 reg_dep | Past instruction number on which there is RAW data dependency |
| optional uint32 weight | To account for committed instructions that were filtered out |
| optional uint64 pc | Instruction address, i.e. the program counter |
| optional uint64 v_addr | Virtual memory address if instruction is a load/store |
| optional uint32 asid | Address Space ID |